Dotun Opasina

  • About
  • AI Projects
  • Practical Datascience
  • Trainings
  • AI Mastery Program
houseprices.jpg

Predicting House Prices in the Massachusetts area using Linear Regression, Support Vector Regression and Random Forest Regression

February 10, 2020 by Oladotun Opasina

Introduction

For this project, I scraped housing data from Zillow websites and used features such as the price, the size of a house in feet, number of beds and baths to predict the price of the house. The goal of this project is to understand multiple regression algorithms and see how they function on a real-world problem.

The Machine Learning Process

The data process included :

  1. Data collection and cleaning: I scraped the data from Zillow websites for the particular cities in Massachusetts and did some data cleaning by removing rows with empty fields and those without bedrooms and baths in their columns. The data was log transformed to ensure that there were perfectly skewed.

  2. Machine Learning Algorithm: The clean data was then passed into multiple machine learning algorithms such as linear regression, support vector regressor and random forest regressor to predict the price of the houses.

  3. Evaluate Machine Learning Algorithms: The myriad algorithms were evaluated to see how they performed. Spoiler alert: Random forest regression did the best amongst the three while linear regression performed worse.

  4. Display Result: The predictor was then sent to a flask app where the users can try multiple inputs to the models to see how the price of the algorithm changes.

Screen Shot 2020-02-10 at 11.24.44 AM.png
 

Machine Learning Introductions

Linear Regression

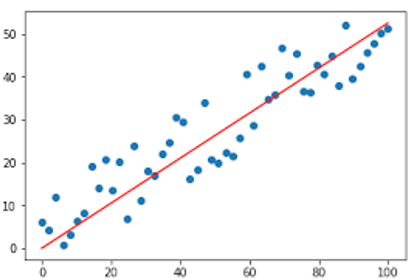
Linear regression is a supervised learning algorithm that fits a line through the data to predict a continuous variable. The algorithm tries to minimize the residuals (the difference between the predicted and actual value) as it calculates its prediction,

Screen Shot 2020-02-10 at 11.37.21 AM.png

Support Vector Regression

Support Vector regression is a supervised learning algorithm that tries to fit the error rate within a threshold boundary line. Usually the boundaries are the innermost threshold that supports the vectors. A threshold is chosen that allows for misclassification to ensure the data is transformed to its right plane.

Screen Shot 2020-02-10 at 11.42.21 AM.png

Random Forest Regression

Random forest regression is a supervised learning algorithm that utilizes a combination of decision trees to produce a continuous output. Usually the combination of models together is called an ensemble model.Random forest uses a Bagging ensemble method (Bootstrapping and Aggregation) to come up with it model output. Bootstrapping is row sampling with replacement and takes the output and then Aggregates the results using a voting classifier to get the output.

Screen Shot 2020-02-10 at 11.55.48 AM.png

Evaluation Metric

The model was evaluated using the R squared metric which basically finds the goodness of fit of the model. There is a generic formula for calculating r squared that can be found online.

Here are the result of the models.

  1. Linear regression: 65.7%

  2. Support Vector Regressor: 71.2%

  3. Random Forest Regressor: 80.4%
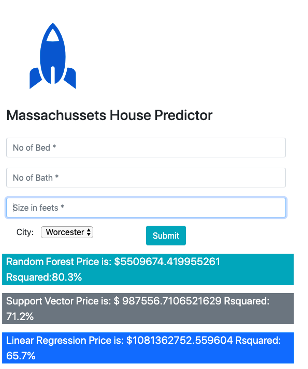

Project Demo

A screenshot of the actual website of the project can be found below. Users can enter their inputs and get results from the different models in the application. Something to note is that we are predicting per city and some cities have more observations than others.

Screen Shot 2020-02-10 at 12.24.56 PM.png

Conclusion and Future Works

Prediction of house prices in the Massachusetts area has been achieved. I need to collect more data for better prediction and develop the flask web ui some more.

Link to the project can be found here on github with my contact.

February 10, 2020 /Oladotun Opasina
Comment
kickstarter-funded.png

Metis Final Project: Predicting Kickstarter Projects Successes using Neural Networks

September 22, 2019 by Oladotun Opasina

We just completed our final project at Metis in Seattle, Washington, USA. These past 12 weeks went by quickly and were filled with many lessons. It is going to take a while to process them and I am glad for the period of growth.

For this project, we were tasked to individually select a passion project and use our newly learned machine learning algorithm skills on them.

After much discussions with our very fine instructors, I decided to focus on predicting successes of Kickstarter data using neural networks and logistic regression.

Tools Used:

  • MongoDB for storing data

  • Python for coding

  • TensorFlow and Keras for neural networks

  • Tableau for data Visualization

  • Flask app for displaying the website

The code and data for this project can be found on Github.

Challenge:

“Why did Football Heroes, a Mobile game company using Kickstarter achieve its goal of 12,000 while CowBell Hero another company that used Kickstarter did not? The goal of this project is to help campaigns succeed as they raise their funds“

This is a Tough Problem

This is a tough problem because Kickstarter data contains both text data such as the project title and description. Tabular data such as the Goal and duration of the project. Hence my project needed to account for this problem.

Screen Shot 2019-09-22 at 12.38.07 PM.png

Data:

The data was collected from Kickstarter web scraper called webroot.io.

  1. Kickstarter data

Steps:

  1. Preprocess data using MongoDB

  2. Split data into text data (title, description ) and tabular data.

  3. Pass the text data into an LSTM neural network and the tabular data into a regularized logistic regression.

  4. Combine all the models together in an ensemble model. The accuracy score of my result was 78.3%

  5. Build a website using Flask app to allow users interact with the output.

Steps for Kickstarter Prediction

Steps for Kickstarter Prediction

Video Demo

Future Work:

Presently, I have a working website that predicts campaign successes and failures. Future work include improving the model names and websites.

Thank You:

I want to use this medium to thank my family, friends and colleagues at Metis for their lessons, patience and opportunity to grow. All of my successes at Metis is because of the positive impact they had on me and my projects. So Thank you.

Gradpicture2JPG.JPG


PowerPoint Slides:

September 22, 2019 /Oladotun Opasina
1 Comment
ChurnAnalytics.jpg

Metis Project 3: Why are My Customers Leaving ? - Using Logistic Regression To Interpret Churn Data

August 12, 2019 by Oladotun Opasina in DataScience, Churn, Marketing

We just finished our week 6 at Metis in Seattle, Washington, USA. These past weeks have gone by quickly, we are half way through the program and the skillsets learned are amazing.

On my last project, I worked on predicting NBA player salaries and the feedback received were extremely useful. Thank you.

For this project, we utilized clustering methods discussed in class to solve a business problem. This project was done individually. I decided to focus on a company’s churn data to figure out what sort of customers are leaving and used logistic regression algorithm. I used Python for coding and Tableau for data visualization.The code and data for this project can be found on Github.

My initial plan was to utilize data from the Economist to cluster and figure out what style of leadership is important for economic growth of countries. This was based on a discussion with my fellow Schwarzman scholar: Lorem Aminathia on the model of leadership to ensure Africa’s growth. Unfortunately, there is not enough of data features to properly evaluate this problem.

Challenge:

“We were consulted by Infinity - a hypothetical internet service provider- to figure out their Churn - which customers are leaving - and where their Growth Team can focus on“

Data:

The data was an IBM telco service churn data on kaggle.

  1. IBM Telco Churn data

Approach:

The Minimum Viable Product (MVP) for our client was to address the following point:

  1. Figure out the number of customers churning.

  2. Find out the most frequent types of customer churning.

  3. Provide recommendation of next steps to take for the program.

Steps:

The following steps were taken to produce results, these steps are general data science steps to a solution and are usually iterative.

  1. Data gathering from our data sources.

  2. Data cleaning

  3. Feature Extractions and Cleaning

  4. Data Insights

  5. Client Recommendations

Insights and Reasons

After downloading , cleaning, and aggregating the datasets, the following were noticed:

  1. About 26% of Customers are churning. Out of 7,000 churn data, close to 2,000 are churning.

churnData.png

2. Logistic Regression (accuracy score of 80 %) provided features of the type of customer most likely and not likely to churn.

The image shows the features that will either lead to customer churn or not. Something that surprised me was the fact that fiber optics users were more likely to churn in comparison to digital subscriber line users - a different type of internet service users. It is surprising because fiber optics internet service is usually faster in connecting to the internet than DSL. Another fact is that fiber optics is usually more expensive than DSL and maybe users are getting tired of paying the premium for the service.


LogisticRegression.png

Recommendation

An immediate next step for the growth team is to provide an option for fiber optics customers that are about to leave to switch to DSL service.

Infinity's Customers Leaving! Stop That Churn. Dotun Opasina

August 12, 2019 /Oladotun Opasina
DataScience, Churn, Marketing
1 Comment
all.jpeg

Metis Project 2: Predicting NBA Player Salaries using Linear Regression

July 21, 2019 by Oladotun Opasina in DataScience, NBA

We just finished our third week at Metis in Seattle, Washington, USA. These past weeks were a roller coaster of learning amazing materials in statistics, python and linear algebra.

On our first project, I worked with other students to provide recommendations for Women in Technology and that experience was amazing.

For our second Project, we worked individually and utilized Linear regression to predict or interpret data on a topic of our choosing. I decided to focus on the NBA because of my rekindled love for the game after watching last seasons tumultuous finals between the Toronto Raptors and the Golden State Warriors.

Even though I worked on this project alone, in understanding the theory, my Metis’ classmate Fatima Loumaini and my instructors helped me.

Big shoutout goes to my ex-Managers at Goldman Sachs who gave me feedback on my model and how to properly create compelling visualizations. Thank you Rose Chen, David Chan and Samanth Muppidi (inside joke).

Goal

The goal of this project is to predict NBA players’ salaries per season based on their statistics using Linear Regression. This project can be used by both Team players and Managers to evaluate the impact a particular player is making on a team and to know whether to increase the players’ salary or trade the player.

Notes:

I am taking the non-traditional approach of explaining my results first and for anyone who is interested in the technicalities of the entire project, can read the remainder of the blog and view the code / presentations .

Results and Insights:

Growing Salaries and Injuries Impacts. Predicting Victor Oladipo’s Salaries:

The model was tested on Victor Oladipo’s per season stats from 2017 - 2019. Victor was the Most Improved Player in 2018 . Using a selection algorithm, the most important stats for a player was selected to predict his salary.

From the charts below, we can see that the ratio of Victor’s actual salaries to his stats increased from year 2017 to 2018 and stayed fixed in year 2019 while my model predicted his salary should have increased from year 2017 to 2018 (but not as high as his actual salary increase) and decrease slightly in 2019. We can see that Victor’s stats from 2017 to 2018 increased while decreasing slightly in 2019.

Observations

In the real world, Victor made a huge impact on his team from 2017 to 2019 (The Indiana Pacers) but got an injury that knocked him out for the season in 2019. This injury affected the impact he made on his team hence the decrease in his stats. A reason why we do not see a change in his salary is because he is currently on a multi-year contract that is usually guaranteed despite injuries.

Screen Shot 2019-07-21 at 6.11.31 PM.png
Plots of Actual Vs. Predicted Player’s Salaries and Players’ Individual Stats Sum for 2017-2019.

Plots of Actual Vs. Predicted Player’s Salaries and Players’ Individual Stats Sum for 2017-2019.

Growing Salaries, Growing Impacts. Predicting Giannis Antetokounmpo Salaries:

The model was tested on Giannis’s stats who was the Most Improved Player in 2017 and the results were used to create the charts below.

From the charts, we can see that the ratio of Giannis’s actual salaries to his stats increased from 2017 to 2019 while my model predicted his salary should have increased from the year 2017 to 2019. Giannis’s stats from 2017 to 2019 saw a steady increase as well. Something worth noting is that my model says that Giannis needs to be making more than his actual salaries from 2017-2019.

Observations

Juxtaposing to the reality, Giannis improved greatly in 2017 and signed a multi year contract that season. Thus we can see an increase in his salaries. My model predicted that because of Giannis’ impact on his team, he should be earning more money. But for Giannis, he cares more about building the Milwaukee Bucks franchise and he is willing to grow with the organization.

Screen Shot 2019-07-21 at 6.40.18 PM.png
Plots of Actual Vs. Predicted Player’s Salaries and Players’ Individual Stats Sum for 2017-2019.

Plots of Actual Vs. Predicted Player’s Salaries and Players’ Individual Stats Sum for 2017-2019.

Growing Salaries, Declining Impact. Predicting Jimmy Butler Salaries:

Finally, the model was evaluated on Jimmy Butler's stats who was the Most Improved Player in 2015 to generate the charts below.

The charts show the ratio of Jimmy’s actual salaries to his stats increased from the year 2017 to 2019 and my model predicted his salary should have decreased over that time period.

We can see that Jimmy’s stats from 2017 to 2019 slightly decreases. Something worth noting is that my model says that Jimmy needs to be making less money than his actual salaries based on his stats.

In actuality, Jimmy’s stats saw a steady decrease from 2017 to 2019 as he switched from the Chicago bulls team to the Minnesota Timberwolves team in 2018 and to the Philadephia 76ers team in 2019. In explaining these phenomena of increasing salaries to decreasing stats, it is general knowledge that a player’s brand also adds to his value and in switching teams, a player needs time to adjust to the style of play of that particular team. So it is not surprising that Jimmy’s stats decreased over time.

Screen Shot 2019-07-21 at 7.18.28 PM.png
Plots of Actual Vs. Predicted Player’s Salaries and Players’ Individual Stats Sum for 2017-2019.

Plots of Actual Vs. Predicted Player’s Salaries and Players’ Individual Stats Sum for 2017-2019.

If you made it this far, then you are interested in technicality of things. Kindly enjoy your read. below and I welcome any constructive feedbacks.

NBA Introduction:

The National Basketball Association is a men's professional basketball league in North America, composed of 30 teams. It is one of the four major professional sports leagues in the United States and Canada, and is widely considered to be the premier men's professional basketball league in the world.

Find the major stats for the NBA in 2019 below:

Major NBA Stats in 2019

Major NBA Stats in 2019

Approach:

The approach for this project was to utilize specific player stats to predict their salaries using linear regression. I utilized the Lasso Algorithm to select the most important player statistics that affected a player salary.

Steps:

The following steps were taken in achieving my goals for this project.

  1. Data scraping and cleaning.

  2. Data and feature engineering.

  3. Model validation and selection.

  4. Model prediction and evaluation.

Data Scraping and Cleaning:

The data for this project was scraped from:

  1. Basketball Reference: a website that contains basketball players stats .

  2. I selected basketball player stats and salaries from 2017 - 2019 for this project.

  3. I chose around 20 unique stats per player.

The python script that was used to scrape the data can be found on my github page.

Data and Feature Engineering:

After performing Lasso algorithm for feature selections I was able to select the 5 specific stats from the 20 unique stats that affected a players salaries. There are namely:

  1. The player’s age

  2. The minutes played per game

  3. The defensive rebounds per game.

  4. The personal fouls per game.

  5. The average points made per game.

The image below shows a HeatMap of the selected NBA stats to the salaries. Notice that the salaries are logarithm transformed to properly scale with the features and all the stats are positively correlated to the salaries which implies that this problem is ideal for linear regression.

HeatMap displaying positive correlation of my different stats to Salary.

HeatMap displaying positive correlation of my different stats to Salary.

Model Validation and Selection:

I split my data into the train and validate sets before fitting the train data with my model. I got a score of 42% for my R-squared which implies the level of variability in my data.

Model Prediction and Evaluation:

After training my model with my train set, I got the predicted salaries for each player from 2017-2019. The insights of this project can be found in the Results and Insights section.

Conclusions:

Players and Team managers can better work together using the NBA prediction model when creating contracts and have a standardized way to evaluate impact.

Future Works:

  1. Collect more NBA data from 2008 - 2019.

  2. Include features on out-of-season Injuries, beginning of contracts for players, and brand value of a player etc.

  3. Figure out ways for players to improve specific stats.

Below is my presentation for the project at Metis. Looking forward to your feedback.

July 21, 2019 /Oladotun Opasina
NBA, Data Science, LASSO, Goldman Sachs
DataScience, NBA
3 Comments
Women in Technology source:https://www.we-worldwide.com/blog/posts/black-women-in-tech

Women in Technology source:https://www.we-worldwide.com/blog/posts/black-women-in-tech

Metis Project 1 : Analysis for WomenTechWomenYes Summer Gala

July 10, 2019 by Oladotun Opasina

We just finished our first week at Metis in Seattle, Washington, USA. The past few days have been a whirlwind of both review and new materials. As our first project, we leveraged the Python modules Pandas and Seaborn to perform rudimentary EDA and data visualization. In this article, I’ll take you through our approach to framing the problem, designing the data pipeline, and ultimately implementing the code. You can find the project on GitHub, along with links to all the data.

I worked with Aisulu Omar from Kazakhstan, Alex Lou, and Dr. Jeremy Lehner both from America on this project.

I am Nigerian and you can find me on Linkedln.

The Challenge:

WomenTechWomenYes (WTWY), a(-n imaginary) non-profit organization in New York City, is raising money for their annual summer gala. . For marketing purposes, they place street teams at entrances to subway stations to collect email addresses. Those who sign up are sent free tickets to the gala. Our goal is to use MTA subway data and other external data sources, to help optimize the placement of the teams, so that they can gather the most signatures of people who will attend and contribute to WTWY’s cause.

Our Data:

We used three main data sources for this project.

  1. MTA Subway data

  2. Yelp Fusion Api to figure out the zip codes of each station.

  3. University of Michigan Median and Mean income data to zip code.

Our Approach:

For our approach, we discussed as a team on what would be our Minimum Viable Product (MVP) for our client and we came up with three goals.

  1. Find the busiest stations by traffic to easily deploy the street teams.

  2. Find the busiest days of the week at the train stations.

  3. Find and join income data to the busiest stations to figure out who will donate to our cause.

Our Steps:

We took the following steps to get our results, these steps are general data science steps to a solution and are usually iterative.

  1. Data gathering from our data sources.

  2. Data cleaning

  3. Data aggregating

  4. Data insights

  5. Client Recommendations

Our Insights and Reasons

After downloading , cleaning, and aggregating the datasets, we noticed the following:

  • Wednesdays are the busiest days

Screen Shot 2019-07-10 at 4.52.55 AM.png

Busiest Day of the Week is Wednesday by Number of Entries

  • The top 5 Busiest stations by traffic are:

    • 34th St - Penn Station

    • 42nd St - Grand Central 

    • 34th St - Herald Square

    • 14th St - Union Sq

    • 42nd St - Times Sq

Busiest5stations.png

Top 5 Busiest NYC Stations in the Summer

Why?

  • This is because the top 5 stations are located near the Midtown Area of New York City which is commonly busy during the summers.

  • Major restaurants, Landmarks , Colleges and Technology Companies are situated around this area.

MidtownRegion.png

Google Map route of the Top 5 Stations in Proximity to one another

  • After joining income data to the busiest stations and filtering for those who made $70,000 and above, we found:

    • Grand Central - 42 Street to be the station with the highest income.

Busiest Stations by Median Household Income

Busiest Stations by Median Household Income

Our Recommendation:

From our analysis we recommend that WomenTechWomenYes deploy street teams on Wednesdays during peak hours to 34 ST Penn Station and 42nd Grand Central to best target their appropriate audience.

Conclusion:

I would like to thank the Metis team and my classmates for their thoughtful questions and feedback. As we continue with future projects, I hope to incorporate those lessons in them. Our slides can be found below

Analysis for WomenTechWomenYes Annual Gala Aisulu, Alex, Dotun and Jeremy Metis 2019

July 10, 2019 /Oladotun Opasina
Comment
  • Newer
  • Older

Powered by Squarespace